|
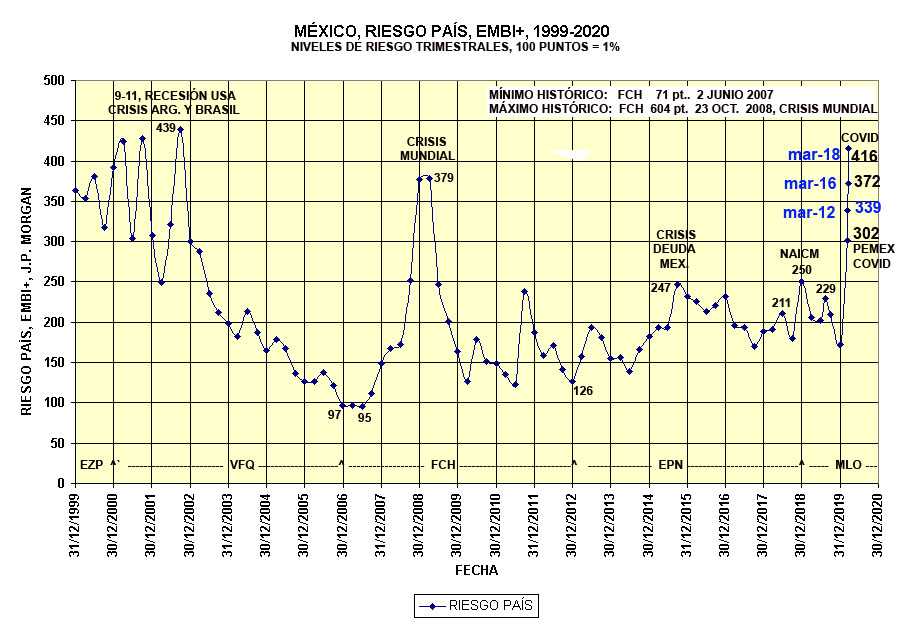
La
gráfica muestra el Riesgo-País, EMBI+, que ha registrado nuestro
país desde 1999, prácticamente desde el inicio de la publicación de
este índice por J.P. Morgan. Está dividido por años, trimestres y sexenios, y
allí se indican las razones por las que pudo aumentar el riesgo de
invertir en nuestro país. Se registran los máximos y mínimos
históricos registrados al final del año, pero es conveniente aclarar
que el nivel mínimo histórico del riesgo país de México fue de 71
puntos, el 2 de junio de 2007 y que además su nivel máximo
histórico fue de 604 puntos base, el 23 de octubre de 2008.
En ambos casos se refieren a fechas durante el sexenio de Felipe
Calderón, etapa dentro de la que se vivió la mayor crisis a nivel
mundial que se haya registrado en la historia.
El Emerging Markets Bond Index
Plus (EMBI+), también
conocido como Riesgo País, mide la diferencia entre la tasa de
interés que un país debe de pagar por emitir deuda en el exterior. con respecto a la
tasa de rédito que pagan los Bonos del Tesoro, norteamericanos,
considerados como bonos gubernamentales libres de riesgo. Cada 100
puntos del EMBI+ corresponden a un punto porcentual de las tasas de
interés. Desde esta perspectiva, el diferencial entre las
tasas de interés es el “premio” exigido por los inversionistas a los
bonos de un país, para compensar el mayor riesgo que se corre por su adquisición.
Además un alto nivel de Riesgo País, lleva implícita la
probabilidad de que una nación incumpla con el pago de la deuda o de
los intereses. En otras palabras, el indicador se utiliza como un
termómetro que mide el estado de salud de la economía de un país.
Una forma práctica de entender el uso del Riesgo País, es como
sigue: A la fecha evaluada en esta página, 5 de diciembre de 2018, el
Riesgo País cerró en 239, es decir equivale a 2.39%, que
sumado al rendimiento de los Bonos del Tesoro en USA, de 2.29% en
esa misma fecha, daría un total de 4.63%. Si se compara esta tasa
con el rendimiento de la tasa lider de Cetes a 28 días, para la
misma fecha, que fue de 7.97%; se deduce que sigue siendo atractiva
para el inversionista extranjero.
El índice EMBI+
se elabora desde el año de 1994 y se compone de 109 instrumentos financieros de 19 países diferentes,
con una capitalización de mercado de aproximadamente 180 billones
de dólares, es una variación del EMBI,
el cual contiene únicamente Bonos Brady. Esta extensión hacia otro
tipo de instrumentos de inversión disponible en estos mercados, hace
del EMBI+ un indicador que se ajusta mejor a la variedad de
oportunidades de inversión que ofrecen los mercados emergentes. El EMBI+
incluye distintos tipos de activos: Bonos Brady, préstamos y
Eurobonos. Los países que actualmente integran el índice son:
Argentina, Brasil, Bulgaria, Colombia, Ecuador, Egipto, Malasia,
México, Marruecos, Nigeria, Panamá, Perú, Filipinas, Polonia, Rusia,
Sudáfrica, Turquía, Ucrania y Venezuela.
Saber calificar el grado de riesgo que representaría invertir en
nuestro propio país, para los mexicanos que no somos
especialistas en asuntos financieros, es algo que por lo general nos
resulta por demás difícil de definir, pero es importante, al
menos, para calificar la manera en que se manejan las finanzas de
nuestro país.
Las siguientes tablas con información oficial de
organismos internacionales,
nos
ayudan a valorar nuestra propia realidad.
Al 11 de febrero de 2016, México rompió la barrera de los 300 puntos
y se ubicó en 311, niveles no observados desde 2008, sin embargo
hasta antes de la cancelación del NAIM, llegó a estar en 182 puntos.
Al 31 de diciembre de 2018 se ubicó en 251 puntos en virtud de la
cancelación de la construcción del NAIM y al 31 de diciembre de 2019
se ubicó en 179. El 9 de marzo de 2020 sube hasta 302 por efecto del
COVID-17 y la caída en los precios del petróleo crudo de
exportación.
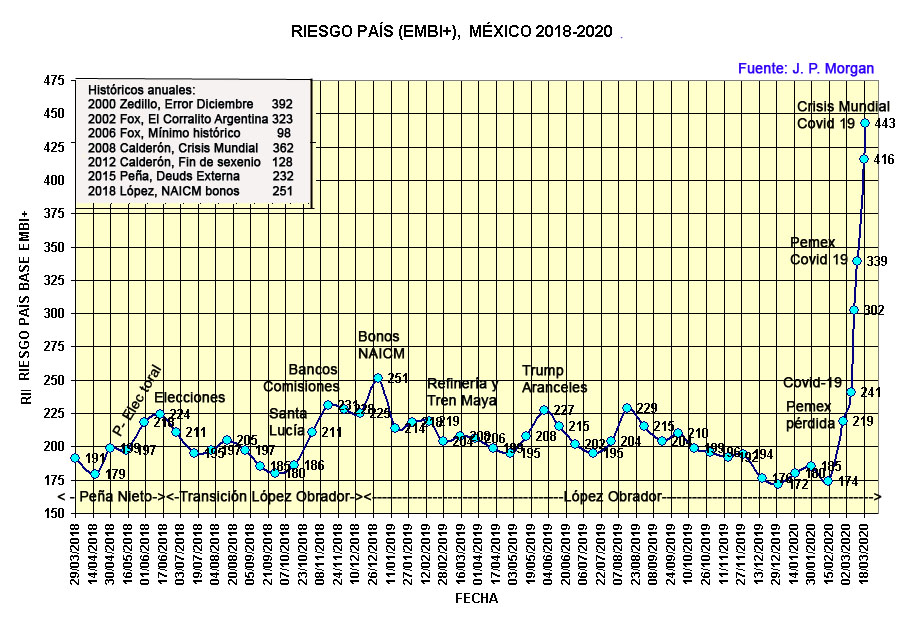
La gráfica siguiente muestra con más
detalle la evolución del Riesgo-País durante el período
correspondiente al Gobierno actual.
|
|
|
|
|
|
|
|
|
|
|
|
|
CALIFICACION DE GRADO DE INVERSION DE DEUDA SOBERANA DE
LARGO PLAZO |
|
Fuente: Standard & Poors |
|
PAIS |
USA |
CANADA |
CHILE |
MEXICO |
COLOMBIA |
PERU |
BRASIL |
VENEZUELA |
ARGENTINA |
|
2000 |
|
|
|
BB |
|
|
|
|
|
|
2001 |
|
|
|
BB |
|
|
|
|
|
|
2002 |
AAA |
AA |
A |
BBB- |
BB |
BB- |
BB- |
B |
D |
|
2003 |
AAA |
AA |
A- |
BBB- |
BB |
BB- |
B+ |
CCC+ |
SD |
|
2004 |
AAA |
AA |
A |
BBB- |
BB |
BB |
BB- |
B |
SD |
|
2005 |
AAA |
AA |
A |
BBB |
BB |
BB |
BB- |
B |
B- |
|
2006 |
AAA |
AA |
A |
BBB |
BB |
BB+ |
BB |
BB- |
B+ |
|
2007 |
AAA |
AA |
A+ |
BBB |
BB |
BB |
BB |
BB- |
B- |
|
2008 |
AAA |
AA |
A+ |
BBB+ |
BB+ |
BB+ |
BBB- |
BB- |
B+ |
|
2009 |
AAA |
AA |
A+ |
BBB |
BB+ |
BBB- |
BBB- |
BB- |
B- |
|
2010 |
AAA |
AA |
A+ |
BBB+ |
BB+ |
BBB- |
BBB- |
BB- |
B- |
|
2011 |
|
|
|
BBB |
|
|
|
|
|
|
2012 |
|
AAA |
|
BBB |
|
|
|
|
|
|
2013 |
AA+ |
AAA |
AA- |
BBB+ |
BBB |
BBB+ |
BBB |
|
CCC+ |
|
2014 |
AA+ |
AAA |
AA- |
BBB+ |
BBB |
BBB+ |
BB+ |
|
SD |
|
2015 |
AA+ |
AAA |
AA- |
BBB+ |
BBB |
BBB+ |
BB+ |
CCC |
SD |
|
2016 |
AA+ |
AAA |
|
BBB+ |
BBB |
BBB+ |
|
|
|
|
2017 |
AA+ |
AAA |
|
BBB+ |
BBB |
BBB+ |
|
|
|
|
2018 |
AA+ |
AAA |
A+ |
BBB+ |
BBB- |
BBB+ |
BB- |
SD |
B |
|
2019 |
AA+ |
AAA |
A+ |
BBB+ |
BBB- |
BBB+ |
BB- |
B- |
CCC- |
|
|
|
|
|
|
|
|
|
|
|
|
Solamente CHILE, MEXICO, y PERU
OSTENTAN GRADO DE INVERSIÓN en
Latinoamérica |
|
México obtuvo el grado de inversión en 2002, lo perdió en
2009, 2011 y 2012, Crisis Mundial. Lo recuperó en 2013 |
|
Calificación en orden de muy buena a muy mala. |
AAA, AA, A, BBB, BB, B, CCC, CC, C, D, SD,
signos + y -, mayor y menor |
|
Grado de Inversión desde BBB+ hasta AAA |
|
|
|
|
|
|
|
|
|
|
|
|
|
|
|
|
|